Types
Four types of drift:
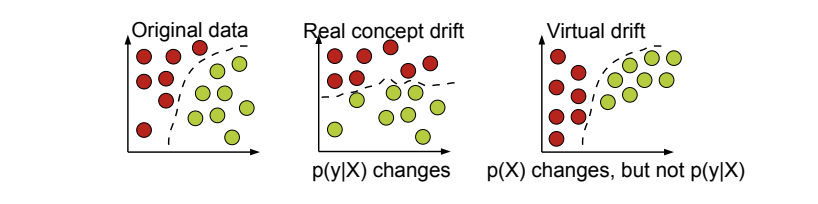
- concept drift: change in , shift in relationship between input and target output. If we have real-time ground truth labels, change in performance is the strongest indicator
- prediction drift: change in
- label drift: change in , shift in ground truth distribution
- feature drift: change in
"Virtual concept drift" has no influence on performance:
Causes
- externalities cause real change in data distribution
- data integrity issues due to data engineering or data collection
How to detect data drift?
No ground truth during inference, therefore cannot use performance metrics like AUC, precision, recall, etc...
Population Stability Index (PSI)
Mostly used in the financial industry
One training population and one scoring population. Divide each in say equal buckets, denoted where is either the training or scoring dataset. For bucket , let's denote the percentage of training data in bucket and the percentage of training data in bucket .
- PSI < 0.1: no significant population change
- 0.1 < PSI < 0.2: slight population change
- PSI >= 0.2: significant population change
Kullback-Leibler divergence
Average number of bits wasted by encodings events from based on .
Standard values?
Jensen-Shannon divergence
Based on KL divergence, except it is symmetric and always has a finite value
Kolmogorov-Smirnov test
Nonparametric test (does not assume a specific distribution)
Largest absolute difference between two distributions functions:
where the empirical distribution function for i.i.d. samples is given by:
If the scoring distribution comes from the reference distribution: almost surely as
Recall: sequence converges almost surely towards if
Frameworks
scikit-multiflow for streaming data.
Papers to read
- https://arxiv.org/pdf/1010.4784.pdf
- https://citeseerx.ist.psu.edu/viewdoc/download?doi=10.1.1.144.2279&rep=rep1&type=pdf
- https://link.springer.com/chapter/10.1007/978-3-540-28645-5_29