
Adjustment for direct causes (p.65-76)
** Example **
Soil fumigants are used to increase oat crop yields by controlling the eel worm population . Fumigants mays have direct effects on yields (beneficial or adversary).
Our goal is to assess the total effect of fumigants on yields. However, to make it harder for us by creating confounding bias, let's assume that:
- controlled randomized experiment is infeasible (the farmer insists on choosing which plot should be fumigated)
- the farmer's choice of treatments depends on last year's eel worm population, denoted , which is unknown.
- The growth of the eel worm population depends on the population of birds, which in turn is correlated with last year's population, hence with the treatment itself.
First, we construct a causal diagram:
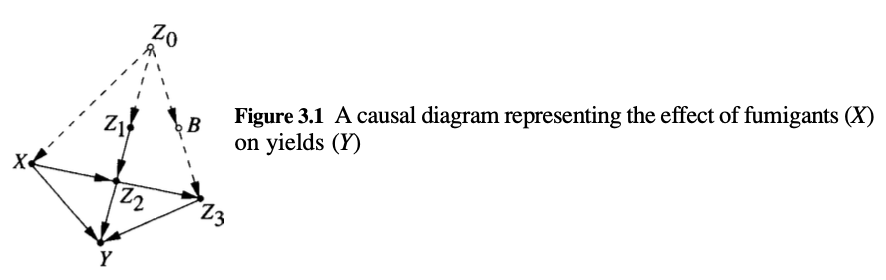 screenshot taken from Causality, p.67
- is last year's eel worm population
- is the population before the treatment
- after the treatment
- at the end of the season
- dashed arrows connect unmeasured quantities, represented as hollow nodes.
- solid arrows connect measured quantities
Note that negative causal assumptions are conveyed through the missing links, e.g. no link between and signifies that fumigants do not affect the growth of the surviving eel worms.
Those are domain specific assumptions and our purpose is not to validate or repudiate them but to determine if they are sufficient to quantity the causal effect from non-experimental data (i.e. estimating the total effect of fumigates on yields).
Our end goal is to show that the total effect of on is:
Instead of probabilistic relationships, we can use functional, deterministic relationships:
where:
- are deterministic functions
- are the parents (causes) of variable
- are mutually independent, random disturbances
The disturbances represent background factors that the investigator chose not to include. If any of them influences two or more variables - thus violating the independence assumption - that factor must enter the analysis as an unmeasured (latent) variable; e.g. or in our example.
The functions and distributions of will remain unspecified throughout.
Functional representations actually yield the same recursive decomposition of the joint distribution, characteristic of Bayesian networks:
In our example:
External intervention
This is the action of setting a variable to some fixed value and is denoted .
This amounts to removing the equation (thus removing the arrows entering on the graph) and substituting in the remaining equations.
We can then compute the new probability function under the intervention. The causal effect of on is given by (sometimes noted in the book).
Alternatively, we acan represent an intervention as an additional variable in the graph, that takes values (the deterministic functional) or (the intervention).
Back to our example. The intervention yields the new distribution:
Theorem 3.2.2: Adjusment for direct causes
Let the set of direct causes (parents) of variable . The effect of intervention of on (any set of variable disjoint of ) is:
We "adjust" for the parents by conditioning on them and weighting by their prior probabilities. This aims at eliminating spurious correlations between cause and effect (some realisations of variables might be more probable than other).
Note that we can intervene on multiple variables at once ( where is some subset of variables).
In summary, given a causal diagram in which all direct causes of intervened variable are observable, we can infer post-intervention distributions from pre-intervention distributions.
In figure 3.1 however, some parents are unobservable ( and ). Next, we will provide graphical tests to determine whether is estimable.
The back-door criterion (p.79)
First, a reminder on what it means for a variable to block a path from to .
d-separation or "blocking" (p.16)
A path is a sequence of consecutive edges of any directionality. If a variable (or set of variables) blocks the path from to , it means that the flow of information is blocked. If we already know , learning about won't give us anything about .
Formally, a path is d-separated or blocked by a set of nodes if and only if:
- there is a chain () or fork () and is in the middle.
- there is no inverted fork (or collider) () where is in the middle.
Basically, a path is blocked by iff . To understand why a collider breaks this dependency, think about . Knowing that the grass is wet but the sprinkler is off helps us deduct that it's raining.
Controlling confounding bias
The book describes Simpson's paradox: "any statistical relationship between two variables may be reversed by including additional factors in the analysis. For example, we may find that students who smoke obtain higher grades than those who do not smoke but, adjusting for age, smokers obtain lower grades in every age groups and, further adjusting for family income, smokers again obtain higher grades than nonsmokers in every income-age group, and so on."
Leaving us with the question, when is adjustment for a given covariate appropriate?
The back-door criterion tells us whether a subset of observed variables is sufficient for identifying where and are observed.
satisfies the back-door criterion relative to and if:
- it blocks every path between and containing an arrow into .
- contains no descendant of (because that would mean has a causal effect on )
is the set of variables that ensure and are d-separated and that are not affected by . We can then change without affecting the probability of (since they are now independent given ).
The causal effect is now given by:
(we adjust for ).
The front-door criterion (p.81)
The first condition of the back-door criterion states that should not be impacted by . The front-door criterion tells us that concomitants that are impacted by treatment can be used to facilitate causal inference.
Take the following graph:
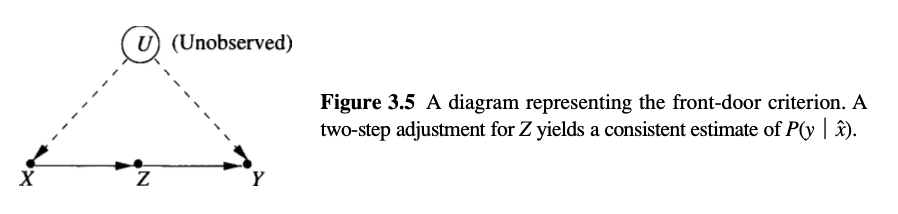
does not satisfy the back-door criterion but measurements of can enable consistent estimation of .
The joint distribution of the graph is given by:
The intervention removes the factor and induces the post-intervention distribution:
Summing over and :
is unobserved but we can get rid of it using the conditional independence assumptions encoded in the graph: and
Thus:
Finally, we are left with observed quantities only:
This process can be interpreted as a two-step application of the back-door formula:
- first, find the causal effect of on , simply since there is no back-door.
- second, compute the causal effect of on , using as the concomitant, to block the path , giving:
The two effects are then combined using:
Formally, satisfies the front-door criterion relative to and if:
-
intercepts all directed paths from to
-
there is no back-door path from to
-
all back-door paths from to are blocked by
In this case, and if then the causal effect of on is given by:
Q: why the positive distribution requirement?
Possible answer: "we can't infer the effect of action from data in which never attains the value in the context wherein the action is applied" (p.78)
"A more powerful symbolic machinery will be introduced in Section 3.4, one that will sidestep algrebraic manipulations such as those used in the derivation of (3.28)".